San Diego County’s Department of Agriculture, Weights and Measures publishes an annual crop report, and the most recent edition puts the value of local agriculture at about $1.67 billion. The headline is useful, but the real information sits in the categories underneath, and some of them are not what most people expect from a region known for tacos and avocados.
What does the crop report actually measure?
The report covers a single growing season and assigns a dollar value to what county growers produced. According to the County News Center, the edition covering the 2024 growing season was released on Oct. 29, 2025, and reported total agriculture value of $1.67 billion, “just over” 1% higher than the year before. The county’s news item did not publish a farm count or total acreage for that edition, so those figures are not given here.
Two points help with reading any edition. First, the report is a measure of value, not volume or profit. A crop can rise in value because prices climbed, because more was harvested, or both, and the county’s own summaries tie changes to those factors. Second, it is a snapshot of one season. Weather, water costs, pests and market prices can move individual categories sharply from year to year.
Why do plants outrank food in a county known for food?
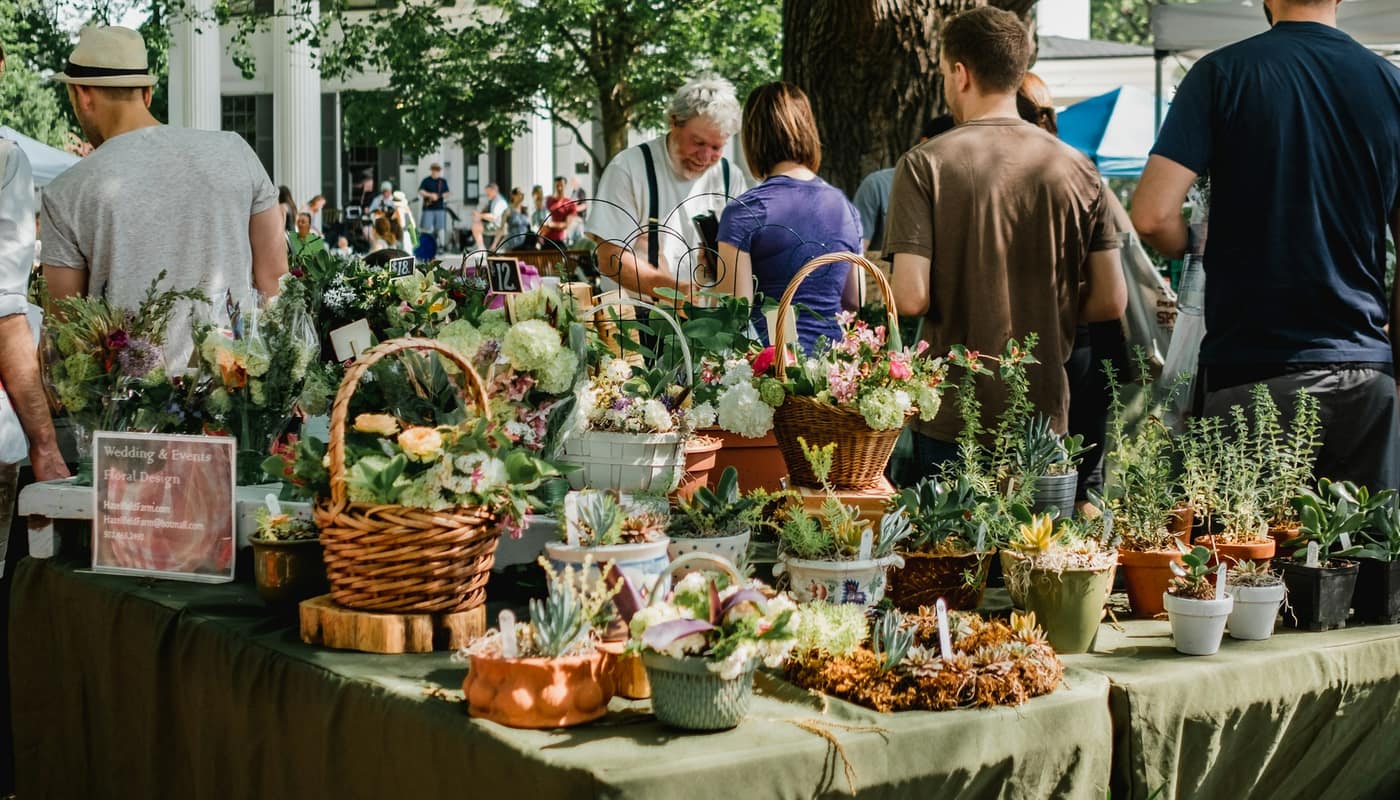
The largest surprise is that the top of the list is dominated by nursery products, meaning plants grown for sale rather than for eating. According to the county’s summary of the 2024 report, the top three crops were bedding plants, color, perennials, cacti and succulents; ornamental trees and shrubs; and indoor flowering and foliage plants. Together they were worth just over $1.08 billion, about 65% of total value, while using 3.4% of agricultural acreage.
The percentage checks out against the totals: $1.08 billion divided by $1.67 billion is roughly 0.65. The 3.4% acreage share is the notable part. Greenhouses and nursery beds produce very high value per acre, which is why a small footprint can outweigh the county’s much larger areas of grove and field crops.
The prior edition shows the same pattern in more detail. The county reported that the 2023 nursery and cut flower group was worth $1,177,552,435, about 71% of that year’s total of roughly $1.66 billion, though that group had slipped 3% from the year before. A 2023 article from the county said San Diego ranks first in California for nursery products.
Where do avocados, citrus and vegetables fit?
Food crops are real contributors, just smaller. In the 2024 report, avocados ranked fourth among individual crops at $99,383,191, according to the county. A category called “Vegetables, Other” rose by 31.1% to more than $98 million and moved past lemons into fifth place.
Several other changes in the 2024 edition, as the county described them:
- Livestock and poultry rose 12.13%, from about $86 million to nearly $97 million.
- The vegetable and vine crops group rose 26.13%, from about $89 million to just over $113 million.
- Citrus value fell 2%, and citrus acreage fell 5%.
- Four of seven crop groups declined: nursery and cut flowers, fruit and nut crops, field crops and apiary (honey bee) products, with field crops and apiary products falling by double digits.
- Apiary products totaled $3,497,675, down 26%.
How have the totals moved over three editions?
A short table helps, using figures reported by the County News Center for each edition.
| Growing season | Reported total | Change noted by the county |
|---|---|---|
| 2022 | $1.78 billion | Up about $24 million, or 1.4%, from 2021 |
| 2023 | About $1.66 billion | Roughly $120 million below 2022 |
| 2024 | $1.67 billion | Up just over 1% |
The 2022 to 2023 drop is consistent with the arithmetic: $1.78 billion minus $1.66 billion is about $120 million. Because the county rounds its totals in news summaries, small differences between editions can reflect rounding, and the full report is the place to check precise values.
What happened to avocados between 2021 and 2024?
Avocados show how much a single crop can swing. For the 2022 season the county reported avocado value of $123 million, up 48% from $82.8 million. For 2023, the county said avocado value fell because of lower acreage, production and prices. For 2024 the figure was $99,383,191. These are reported values, and the county’s summaries do not claim to explain every cause of the movement, so any longer story about weather, water or demand should be treated as separate from the report itself.
Water is one background factor that readers can follow separately, since irrigated farming in the region depends on supplies described in where San Diego’s water comes from. The crop report does not allocate its changes to water costs, and this article does not either.
Is the report the same as a count of farms?
No. The crop report values what was grown. It is not a census of farms or a measure of how many people farm. The farm counts and sizes that appear in agricultural discussions come from different sources, such as the federal Census of Agriculture, and farm numbers quoted in various places are often undated. Readers who want a farm count should use the federal census profile for the county and note which census year it covers.
Likewise, acreage in the crop report refers to commercial agricultural acreage. The county reported 214,438 acres for 2022, down from 219,874 acres in 2021, a decline of about 5,000 acres, or 2.5%. Check: 219,874 minus 214,438 is 5,436, and 5,436 divided by 219,874 is about 2.5%.
How does San Diego compare with the state?
California’s food and farm economy is far larger. According to the California Department of Food and Agriculture, which cites USDA Economic Research Service data, state farms and ranches received $64.7 billion in cash receipts for 2025, up 4.5% from the previous year. The state’s top commodities that year included milk at $8.39 billion, almonds at $6.87 billion, cattle and calves at $6.19 billion, and grapes at $5.21 billion.
Those are different measures from the county’s report: the state figure is for 2025 and comes from federal data, while the county figure covers 2024 and comes from the county’s own survey. Placing them side by side as a percentage share would mix years and methods, so this article does not. What the comparison does show is a contrast in mix. At the state level the leaders are dairy, nuts, livestock and grapes; in San Diego County, plants lead, and avocados ranked fourth among individual crops in 2024.
How can readers use the report when they shop and eat?
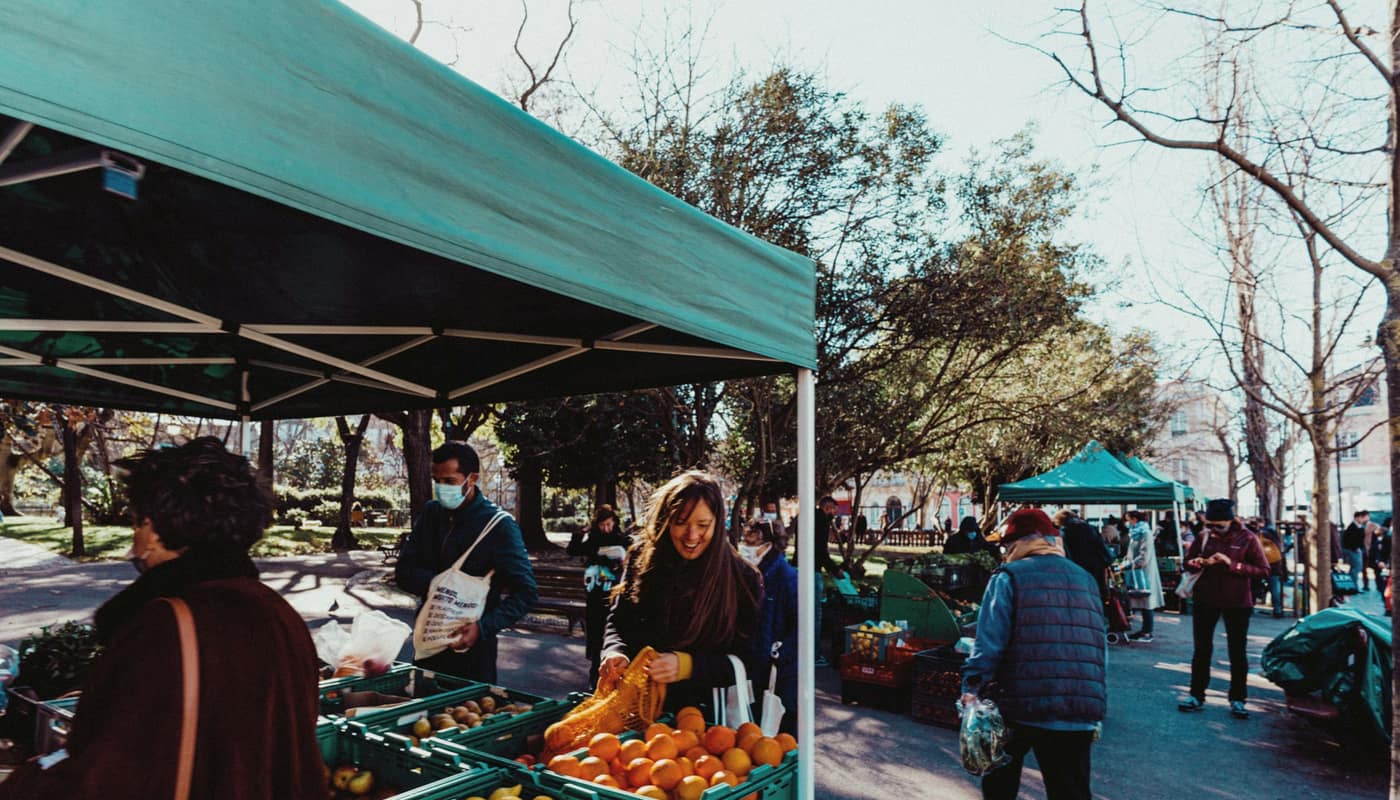
The report is a reminder that local agriculture is more varied than any one market stall suggests. Shoppers interested in how produce is sold directly can read how to shop San Diego’s certified farmers’ markets. Seafood, which does not appear in a crop report, is covered in where San Diego’s seafood comes from, and the region’s brewing story, which relies on grain and hops grown elsewhere, is in the craft beer guide.
A few habits make the next edition easier to interpret:
- Look at the category and its share of total value, not only the total.
- Compare value changes with notes about acreage, production and price.
- Remember that “value” is not “profit,” and that farm costs are not part of the headline number.
- Use the county’s full report, not a news summary, for exact figures, since summaries show some rankings only as images.
A snapshot with limits
The crop report offers a steady yearly reference point: about $1.67 billion in 2024, a county economy of plants first and food crops second, and visible swings in crops like avocados and vegetables. It does not count farms, measure farm income or explain why values changed. Used with those limits in mind, it is a reliable way to see what San Diego County actually grows. For current figures and the full report, readers should consult the county’s Agriculture, Weights and Measures department.
This article is general information about published agricultural statistics, not financial, investment or business advice.
Sources: County of San Diego County News Center; California Department of Food and Agriculture